Digital Experience Platform
A window to continuous improvement
- See exactly where you stand compared against the competition, and how to improve.
- Guide your conversion optimization efforts with clear priorities.
- Use detailed feedback from hundreds of real customer experiences to boost website performance.

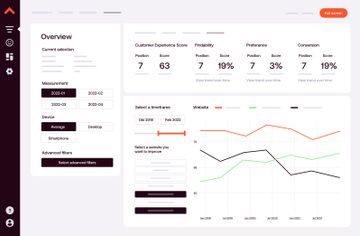
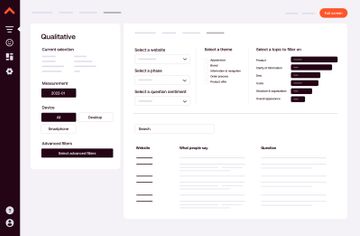
Stay on Track
Align all your teams with clear goals and priorities. Your interactive dashboard tracks your progress and informs targeted improvements that really matter. WUA gives you clear KPIs that guide every team towards the same goal.
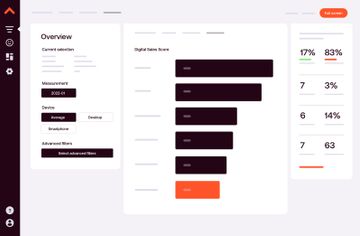
Move up the leaderboard
Your ranking is much more than a list. It shows how you are losing out to the competition, and how close they are to overtaking you. With detailed feedback and clear answers, you know why – and what to do to stay at the top. Track your performance over time to get an even clearer picture of your success.
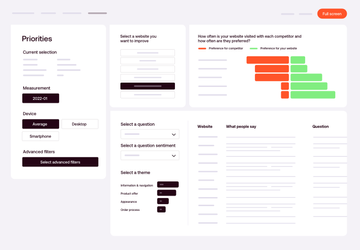
Build your strengths, eliminate your weaknesses.
Use clear indicators to precisely target improvements with the most strategic importance. Our predictive modeling tools will help you see where the greatest impacts can be made. Understand which actions are needed to improve your Sales Score and CX Score, and know that you’re spending resources wisely.
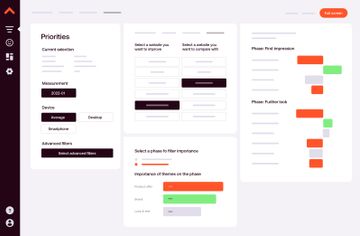
Get the customer perspective
Ensure you’re offering the most customer-centric digital experience possible. WUA gives you the deep insights about real customer perspectives and hard data that you need to see where the priorities are.
At a glance, you know exactly what to do right now to have the greatest impact on optimizing your digital customer experience.
What our clients say
"The researchers at WUA have helped us enormously to improve the customer experience on our websites. With the methodology behind their sales and service benchmark, we have gained far-reaching insights into the online behavior and experiences of entrepreneurs. This enabled us to implement concrete improvements in functional, rational and emotional experience."
Martijn Lentz Practice Lead Customer Experience at KVK
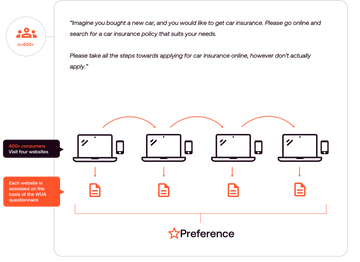
Hundreds of voices. One clear message.
Your WUA research team tasks 400+ consumers (200 minimum, per device type) with a realistic goal. Will they find you, or your competitors? Which do they choose – and, more importantly – why?
Each step of your customer’s journey is catalogued and measured, with the captured data being converted into meaningful reports, insights, and metrics.
Quantitative and Qualitative data and detailed feedback gives you a ‘big picture’ vision of how the customer actually experiences your website. You can zoom-in and see the fine details each customer experience. You can see precisely what’s working – and what isn’t. Even better – you get the same granular insights about your competitors too, so you can see what they’re doing (and how well it works for them).
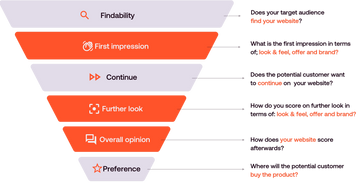
Validated research model
Our research model is the basis of every study. Using this model, the details of the online orientation process are mapped using a funnel. Ultimately, the performance of a website is shown in Market Share and a Website Experience Score.
The approach and set-up of this model is the same for every study. This makes it possible to compare the results of websites and we can see which websites are performing well and which are less well.
With the WUA Digital Experience Benchmark you can clearly see your online performance compared to the competition and over 30,000 other websites.
Staying at the top of your game takes work
With your Digital CX Benchmark study you know how you measure-up and where to focus.
Are you offering the best possible Digital Experience for your customers? Conversion optimization is just the beginning.
Get the big picture with a global perspective on how your customer experience compares to the best digital experiences. Digital CX Benchmarking gives you the comprehensive overview you need to beat the competition and offer your customers the very best digital experience.