Set your digital focus with The Bubble Chart for Market Performance
WUA’s Digital Sales Benchmark studies draw on hundreds of respondents to map out markets in terms of both online sales performance and digital experience. The graph below shows Findability, Preference and Conversion at work. At WUA, we call this the “Bubble Chart” for market performance.
The Bubble Chart
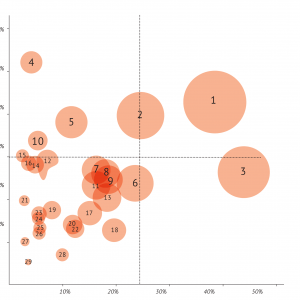
The horizontal axis shows Findability: The percentage of consumers who find and visit a website during their search for a specific product or service.
The vertical axis shows Conversion: The percentage of visitors a website is able to convince to buy .
The size of the circle is determined by the absolute Preference for the website within the market. That is how many of the respondents choose this website. The larger the circle, the higher the Preference
The graph shows the relationship between Findability and Conversion. Websites that are frequently found and visited but manage to convince relatively few of these visitors appear at the bottom right. At the top left are websites that are highly convincing, but not often found.
Increasing your sales share
Each corner of the Bubble Chart has its own focus. This is your guide to improving your website’s performance. What should you invest in? What should you stop, start or continue?
Top left: Niche players or differentiators
These parties can rely on a loyal fan base or “own” a specific niche in the market.
Continue: These parties are appreciated for their Customer Experience. It’s advisable for them to keep innovate and tend to their customers’ needs to maintain that loyal fan base.
Invest in: To attract more potential fans, invest in Findability to play along with the leaders.
Top right: Leaders
These suppliers are often the dominant players in the market and overperform on both Findability and CX.
Continue: Both Customer Experience and Findability are on point. Maintain this position through continuous innovation and stay on course with Findability.
Invest in: Your customers’ needs and wants are always changing. Stay innovative with User Experience and Customer Experience to maintain this leading position.
Bottom left: Potentials
These providers have a lot of (growth) potential.
Continue: A small group of customers are fans: Keep servicing the needs of this small group of clients.
Invest in: As the name suggests, these players can become more dominant by improving Findability and Customer Experience.
Bottom right: Laggards
Often these players are well known large brands with high Findability through television commercials and an SEA budget, but lack a good CX.
Continue: Keeping up the (high) Findability.
Invest in: The website could use some improvement to better accommodate customers. Move to the top right corner by investing in UX/CX Innovation.
Be or beat the best online
Want to know what the focus of your website should be? See our results page for recent studies, schedule a demo or call to see if we have data available for your website. WUA empowers its (international) clients to sell more online. Achieve higher customer satisfaction and increase user experience and conversion rates by focusing on the consumer perspective. We believe in benchmarking customer journeys. We have data of all relevant players in the Automotive, Finance, Insurance, Travel, Retail, Public Sector, Telecom and Energy sector!